A TALE OF RECOVERY: "THE MATHEMATICS OF RECOVERY"
Carlos M. Sera, MBA
September 1, 2015
 My daughter tells me that I need to write a tale that speaks about percentages. She says people don’t understand the way money grows and until they do, they can’t really develop an investment approach. This tale is basic and should be read along with A Compounding Tale and if you don’t understand this tale you need to read it until you do. It’s important on many levels.
Like everyone, when first introduced to the concept of money growth, I was taught the power of compounding over time and at different interest rates. The next logical progression was to demonstrate the loss of purchasing power due to inflation. You can read about the insidious nature of inflation in An Inflationary Tale. But I was never taught the Mathematics of Recovery Effect or what I call the MORE. This tale gets its title because investors need to understand how portfolios recover from losses.
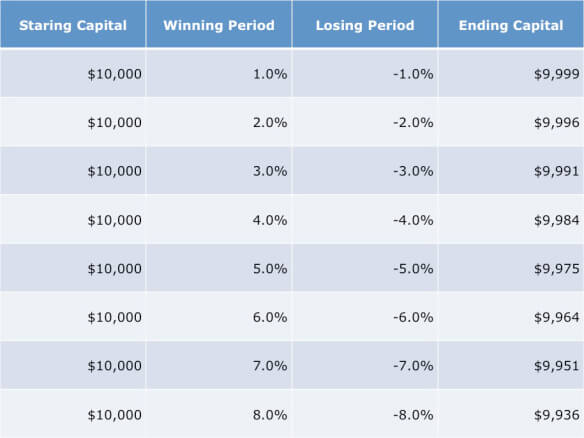
What is the Mathematics of Recovery Effect? The MORE is the slow, steady and totally predictable deterioration of capital over time when dealing with symmetrical percentage returns instead of symmetrical absolute returns. For example, a 5% loss creates more portfolio damage than a 5% gain over time as the table below shows. From the table we can see that if the starting capital is $10,000 and returns are 5% one period and then lose 5% the next period that you end up with $9,975. For a portfolio to grow it must either have 1) More winning periods than losing periods if percentage gains and losses are symmetrical or 2) Percentage gains can’t be symmetrical and percentage gains must exceed percentage losses.
The Mathematics of Recovery For 2 Periods

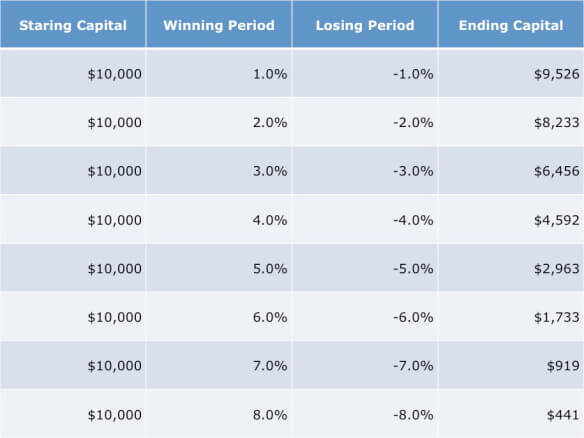
Unfortunately, we can’t stop here. We don’t live in a world where there are just 2 periods. We live in a world where we must invest for a lifetime and for institutions, perhaps indefinitely. So we need to understand what happens over time. Let’s take 972 periods as a good time to examine. You will see why I choose 972 periods later. Let’s assume we get symmetrical returns as we did for just 2 periods and see what happens.What is also clear from the table above is that the more volatile the symmetry of the movements, the lower the ending capital. What this translates to in practice is clear. The more volatile the markets you trade the larger the percentage difference between winning periods and losing periods or the more winning periods are required in order to just get back to breakeven.
The Mathematics of Recovery For 972 Periods

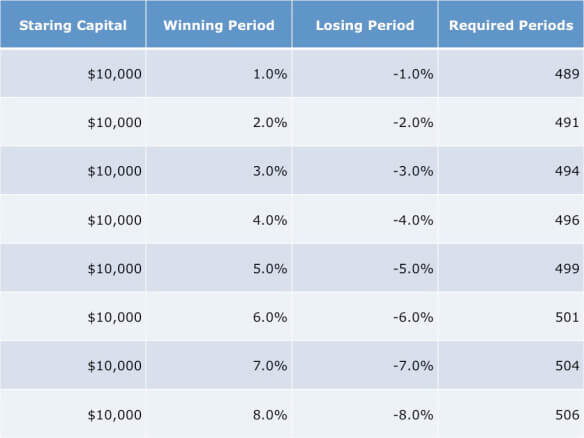
The Mathematics of Recovery For 972 Periods This table is even more compelling in demonstrating the MORE as well as how with increased symmetrical volatility you must work harder to recover losses by having more winning than losing periods. To be clear, what this table says is that if you have 972 periods where you invest and 486 periods are winners and 486 are losers, you can’t make money due to the MORE and the more volatile the periods the more you lose. The next logical question becomes, how many more periods are required to exceed my starting capital if I assume symmetrical returns?

Let’s understand this table. It says for example, that if we have symmetrical winning and losing periods for 972 periods and we have a starting capital of $10,000 then in order to overcome the MORE and we assume a 4% return, we must have 496 winning periods out of the 972 total periods in order to just breakeven. These 10 extra winning periods at 4% are enough to make sure that instead of our ending capital growing to $4,592 that it exceeds $10,000. This is significant because it proves that a continuous investment process does not behave like a coin toss. Assuming symmetry, in order to just breakeven, you must have more winning periods than losing periods.
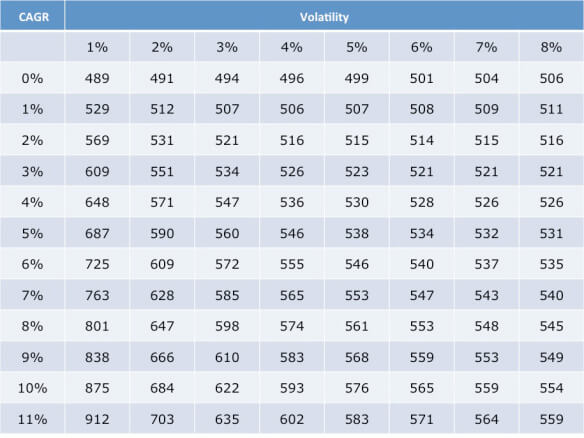
What’s next? The following table shows the hurdle rate required in terms of winning periods to make a positive Compounded Annual Growth Rates at different period volatilities. We will soon tie this in to the stock and bond market or whatever market you might be trading.
Required Winning Periods Out of 972 Periods

As we can see from this table if you look at a CAGR of 0% we get the same number of required winning periods as we did in the previous table. This table expands the concept. If you have a CAGR hurdle rate of 4% for example, and period volatility is 7% then you need 526 winning periods out of the 972 in order to make a CAGR of greater than 4%.
In the case of the US stock market for example, over the last 972 months or 81 years, the monthly volatility has been approximately 4% and the symmetry has been almost identical and since the CAGR over the last 81 years is between 9% and 10%, then the table predicts that there should be between 583 and 593 winning months observed in the stock market over a continuous 972 month period. For bonds, the monthly volatility has been less than 1% and the CAGR has been between 5% and 6% so it would predict 687 to 725 required winning months. You can use this table for anything you may trade. All it says is given a set volatility and target CAGR how many periods are required to exceed the target. If you are so inclined you can translate the table to a percentage table.
So what really happened in the stock and bond market over a 972 month period from 1928-2008? We observed 600 winning periods in the stock market and 685 periods in the bond market. This is right along the lines predicted by the table. The average winning month for stocks had a rate of return of 3.9155% while the average losing month lost 3.9708%. The average winning month in the bond market had a .9670% gain while the average losing month lost .8038%. Curiously enough, while the average losing month in the stock market was slightly higher than the average winning month, in the bond market the reverse is true. As you can find out in An Analytical Tale the reason is due to the last 30 years.
One of the advantages of understanding the MORE is that you begin to see that the stock market is not like a coin toss. The last 81 years has shown that the stock market exhibits almost identical monthly volatility symmetry at approximately 4%. This means that if the market is to average a 9% CAGR over the next 81 years and volatility remains symmetrical then you need 583 winning months out of the 972. This means the required number of winning months must be almost 60%. So, when you hear that stocks go up because of this reason or whatever some bright professor or guru is telling you, remember, the most significant reason they go up is due to their nature or volatility in conjunction with the MORE.
Categories
Strategize Your Success

