AN ALTO MAR TALE: "THE MAXIMUM DRAW DOWN"
Carlos M. Sera, MBA
September 1, 2015
 When I was in elementary school we would spend endless, countless, boring hours focusing on the three R’s: reading, writing and arithmetic. While most can commiserate with my experience towards the three R’s, nowadays, I find myself focusing on The Three R’s of Investing: the Reward, the Risk and the Ratio. Over the past 25 years, The Three R’s of Investing have helped me manage money for clients and here’s how they can help you.
In my opinion, the Ratio of Reward to Risk or simply Reward divided by Risk is the simplest way to understand the essential behavior or price movement of any investment. As a rule of thumb, the higher the Ratio the better the investment and the more likely an investor will be to hold a particular investment or stick with a particular investment philosophy. This ratio has a name and was not developed by me. It was originally developed to analyze commodity trading systems and is called The MAR Ratio. I have adopted this ratio to measure more than just commodity trading systems since I view any investment that has historical and continuous price data as a trading system. To emphasize how attractive I consider investments that have high MAR Ratios, I have created The Financial Tales Portfolio.
As a tribute to my heritage, Alto means High in Spanish and just like the name says–it strives to deliver an Alto or High MAR Ratio for those that embrace the approach. This tale is called An Alto Mar Tale because it will give you a simple way to analyze the relationship between reward and risk associated with an individual investment such as a stock or bond or a broad-based investment such as a portfolio style, asset class, index or philosophy. This tale and especially A Practical Tale will also give you a rudimentary yet very effective and intuitive way of comparing one investment to another.
Let’s take a look at the first R of the three R’s, Reward. We are all familiar with the word reward. The investment word doesn’t try to confuse or break any new ground when using this word. In investment parlance like in normal language, reward is a good thing. It is positive. It is measured by the positive rate of return an investment is expected to make over time. It is the expected compounded annual growth rate of an investment or CAGR.
Now, we’ll examine the word Risk. Unlike academicians that define risk in ways that have absolutely nothing to do with reality, we define risk by answering the following 2-part question;
1) What is the maximum amount of money I could lose if I invested in a particular Security or Property or Portfolio or Index or Mutual Fund or ETF or Etc. at the worst possible time and,
2) If I were to have invested at the worst possible time, how long will it take before I recover my initial investment?
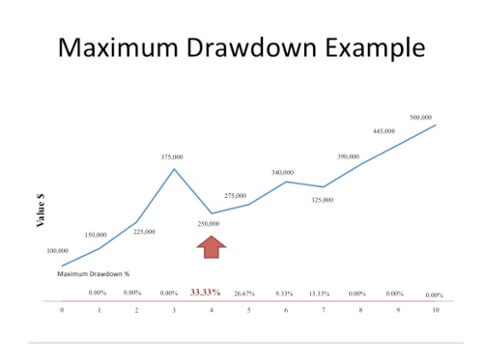
The answer to the above is called the Maximum Draw Down or MDD of an investment and is the subtitle of this tale. It is how we define risk and can be used to analyze the risk of just about anything you might want to own. It is very important to pay attention to part 2 of the question because you can’t calculate an investment’s MDD until it has exceeded its initial investment. This is just common sense because one can’t tell if an investment has stopped going down from where it was purchased until it has exceeded the purchase price.
Let’s look at a recent US stock market example to understand how to calculate MDD or risk.
Had you invested in the S&P 500 at the peak price in September 2000, then at the lowest price in October 2002 your capital would have declined by almost 50%. The peak price of the S&P 500 was not exceeded until June of 2007, or almost 7 years after the 2000 peak. It is only in June of 2007 that you can precisely measure the MDD that occurred from September 2000 to October 2002. Once again, this almost 50% drop is called TheMaximum Draw Down or MDD and is how I define risk and you should as well. It is a critical term to understand and can’t be over-emphasized. Believe me when I tell you that if you don’t pay attention to this term and how it applies to every investment in your portfolio you could be in big trouble. As a practical example, a retiree would much rather retire in October of 2002 after a 50% market decline than in September of 2000 before a 50% market decline. Since most investors have no way of knowing what stage the market is in when they retire—they better understand the nature of the investments they own. Timing matters and investing in a way that reduces MDD or risk is one of the best ways to tilt things in your favor.
Once again, risk is the MDD of an investment or how much an investment can lose if purchased at the most inopportune time. It’s important to assume you will make an investment at the least opportune time because anything other than this assumption would give you an edge over other market participants. If you have this edge, then power to you. But if you do not, then you fall under the category of investors that will either purchase something at the least opportune time, retire at the least opportune time or already own it when it peaks. Since it’s natural for a person to look at their portfolio and when they see it peak consider it “their money”, then it is also natural for them to see a loss from this peak as a loss of “their money.” This natural behavior is the reason it’s imperative that we measure how much of a decline a portfolio or individual investment can suffer.
Getting back to the word risk, it’s more complicated than reward because there are so many clever yet useless ways to define it. Some think of it as negative reward. Others think of it as how volatile the price of the particular investment can behave over time. Others perceive of it as the possibility of a loss of permanent capital over time. We think of risk in a simple manner. In case you haven’t been paying attention, we define risk as follows;
How much money could I lose if I invested at the worst possible time before I recover my initial investment?
We know this is not the way risk is defined in Modern Portfolio Theory, which uses volatility or standard deviation as the definition. While standard deviation provides certain insights that MDD doesn’t, it lacks the behavioral reality that is meaningful to investors. As I have said countless times, Modern Portfolio Theory and standard deviation treat risk as though a person would be equally happy going from poverty to wealth as from wealth to poverty. This is simply not true. Thus in our opinion MPT, in looking at risk in a symmetrical manner, is not a reflection of reality. We therefore define risk the same way our clients do. It’s the natural way to define risk. We think we are in good company. When Warren Buffett’s business partner, Charlie Munger, was asked how he defined riskhe looked a bit confounded as though someone had asked him a trick question and said, “Risk is defined by how much money you can lose.” I urge all to adopt this same attitude and definition.
We learned earlier that the SP500 declined by about 50% from September 2000 through October 2002 and more recently declined by more than 55% from November 2007 through March of 2009. So the risk or MDD of the SP500 is approximately 55%. If you want to go to an extreme you could even say the risk or MDD is approximately 85% because that’s how much the US stock market declined from the 1929 peak to the 1932 trough. The exact amount is not as important as the fact that you must understand that stock market investing is riskier than for example—-money market investing where there is no MDD since by definition a money market investment cannot be worth less tomorrow than today.
The purpose of The MAR Ratio is to try to bring some method of comparing one investment to another. As you will learn, it falls short at extremes or when analyzing investments that have no MDD but is invaluable for the vast majority of investment products. As you will learn when you read A Personal Tale, I had to develop The Sera Ratio to be able to compare different investments even under extreme conditions. However, for most conditions, The MAR Ratio is more than adequate.
The last R of the three R’s, the Ratio of Reward to Risk, helps us compare individual investments. If a particular investment is expected to make or average 5% over time but if you invested at the worst possible time it could lose you as much as 10% before you recover your initial investment then it would have a ratio of .50 or 5% divided by 10%. This is also known as the MAR Ratio of the particular investment analyzed. Specifically the MAR Ratio of an investment is the expected annual compounded growth rate of the investment over time divided by the worst possible loss if you started or invested at the worst possible time. We will keep it short and formulaically define it as the MAR Ratio is (CAGR/MDD). We will define CAGR as reward and it must be positive and we will define MDD as risk.
Let’s make sure we understand The MAR Ratio by taking a short quiz.
1) What is the MAR Ratio of an investment that is expected to make 10% per year over time and can have periods where if you started at the exact worst time could lose as much as 50% of your money? If you answered that the MAR Ratio is .20 you are correct. You simply divide the expected compounded annual growth rate (CAGR) or 10% by the Maximum Draw Down (MDD) or 50%.
2) What is the MAR Ratio of an investment that is expected to make 8% per year over time and can have periods where if you started at the exact worst time could lose as much as 24% of your money? If you answered .33 you are correct. You simply divide the expected compounded annual growth rate (CAGR) or 8% by the Maximum Draw Down (MDD) or 24%. BTW, you will learn why this is probably a better investment than 1) above when you read A Transformative Tale and A Personal Tale.
3) What is the MAR Ratio of an investment that is expected to make 8% per year over time and can have periods where if you started at the exact worst time could lose as much as 64% of your money? If you answered .125 you are correct. You simply divide the expected compounded annual growth rate (CAGR) or 8% by the Maximum Draw Down (MDD) or 64%. This in my opinion is clearly a worst investment than 2) above because it is only expected to earn an equal return of 8% but could lose me more since it has a higher MDD.
4) This is the last question. What is the MAR Ratio of an investment that is expected to make 1% per year over time and can’t lose you money because it is guaranteed to not lose money. If you answered infinity you are correct. You simply divide the expected compounded annual growth rate (CAGR) or 1% by the Maximum Draw Down (MDD) or 0% to get infinity since division by zero is not allowed. This is an important concept to understand because an investment that is guaranteed and can’t lose money is called a Risk-Free Investment and the quoted rate of 1% is called the Risk-Free Rate. It is a fundamental building block in Modern Portfolio Theory and will also be an important concept to understand when using The Sera Ratio for analyzing investments.
So which of the 4 investments in our quiz is the best and which is the worst? If you simply go by the notion that the higher the MAR Ratio the better the investment then #4 is the best, followed by #2, then #1 and #3 is clearly the worst. If you are seeking to maximize CAGR then #1 is the best, followed by #2 and #3 equally and #4 is the worst. Can we learn anything else from these 4 investments? The answer is yes. We can see that given a choice between investment #2 and #3 an investor that would not be allowed to trade or sell investment #2 or #3 should choose investment #2 because it will earn him the same 8% as investment #3 but has a lower MDD and during the worst of possible times it will only lose 24% vs. 64%. However, this is not always the case in real life because investors are allowed to trade or sell their investments and some may choose to overlook the long term odds that are stacked against them because they perceive themselves as nimble traders.
So what have we learned or can deduce? We’ve learned that as a general rule of thumb, the higher the MAR Ratio the better since most people would choose investment #2 over #3. We’ve also learned that many investors would prefer investment #1, #2 or #3 to investment #4 because the CAGR is so much higher despite the potential of losses or risk. It is a risk they believe worth taking. Conversely, there are people that prefer investment #4 because they simply have no tolerance for risk or potential losses. While we recognize that people will always have preferences and that these preferences are not always rational, we believe the MAR Ratio is a simple, intuitive way to analyze the pros and cons as well as the expected future price behavior of a particular investment.
This is the first of 5 tales and should be read in order. The second tale is called A Practical Tale and focuses on analyzing the MAR Ratio of actual potential investments in selected stocks, indices, mutual funds and ETFs. The third tale is called A Transformative Tale and introduces the concept of using leverage or borrowed money to change the reward to risk dynamics of an investment. This tale will also show you how it is possible to make better than stock market rates of return with less risk than the stock market. The fourth tale is called A Personal Tale and where I will introduce The Sera Ratio. I developed it to help me analyze investments, investment styles and portfolios suitable for investors looking to accumulating wealth as well as those looking to not outlive their assets. It sheds insight as to which investment of the 4 in our quiz is the best. The fifth and last tale is called An Indexed Tale and will focus on the one and only insurance contract I have ever analyzed that is in line with high Mar Ratio investing. After you have read all 5 tales I hope you have a much better appreciation for your portfolio and what you can expect from it as well as each of your holdings.

Categories
Strategize Your Success